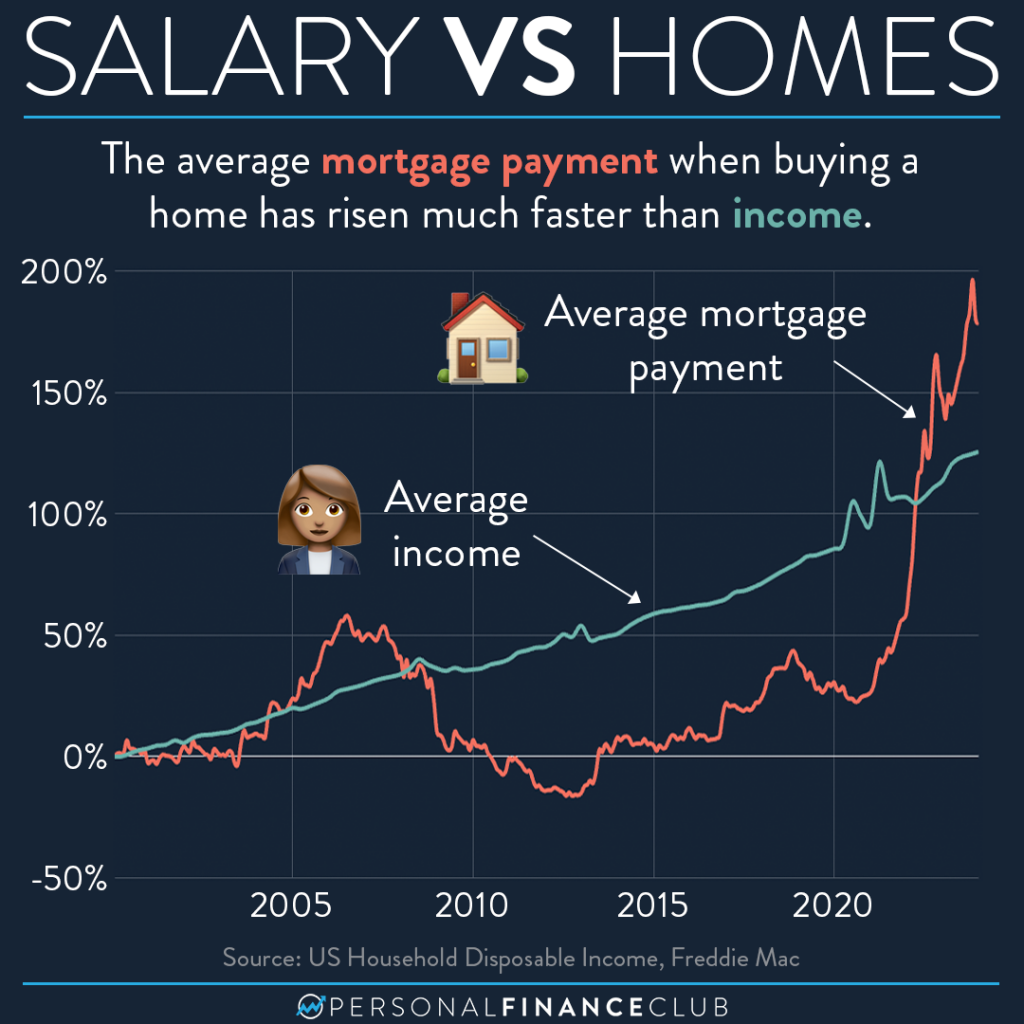
If it feels like your income hasn’t kept up with your ability to buy a home the last couple years, that’s because it’s unfortunately true for most people.
This graph looks at the change in US Household Disposable Income since 2000 and compares it with the average monthly mortgage payment. To calculate the mortgage payment, we are looking at the median home sale price in the US and calculating the payment using the average interest rate on a 30 year fixed mortgage and assuming a 10% down payment.
We did NOT factor in property taxes, insurance, maintenance and so on in the cost of owning a home since those can vary a lot. BUT those should be factored into your calculations if you are buying a home. The red line in the graph is just the monthly mortgage payment.
What happens from here? Who knows. The cost of buying could come down eventually if home prices go down or mortgage rates go down. But, don’t make decisions about where to live based on what you think will happen in the market. Never buy a home with the assumption of being able to refinance your mortgage at a lower rate in the future. If buying the home only makes sense if rates drop, don’t buy the home.
As always, reminding you to build wealth by following the two PFC rules: 1.) Live below your means and 2.) Invest early and often.
-Vivi & Shane